

代码拉取完成,页面将自动刷新
Visualization of data is required for most scientific research. Based on visual graphics, we can better display the major features of scientific data. The clinical medical students and junior researchers frequently need to spend dozens of days or even months to learn visualization tools, such as SPSS, Origin, and Graphpad. If you want to specialize in data analysis and modeling, you need to learn one or more programming languages (such as MATLAB, R, and Python). To reach the level where you can freely explore data, you need to spend more time on in-depth learning and advanced.
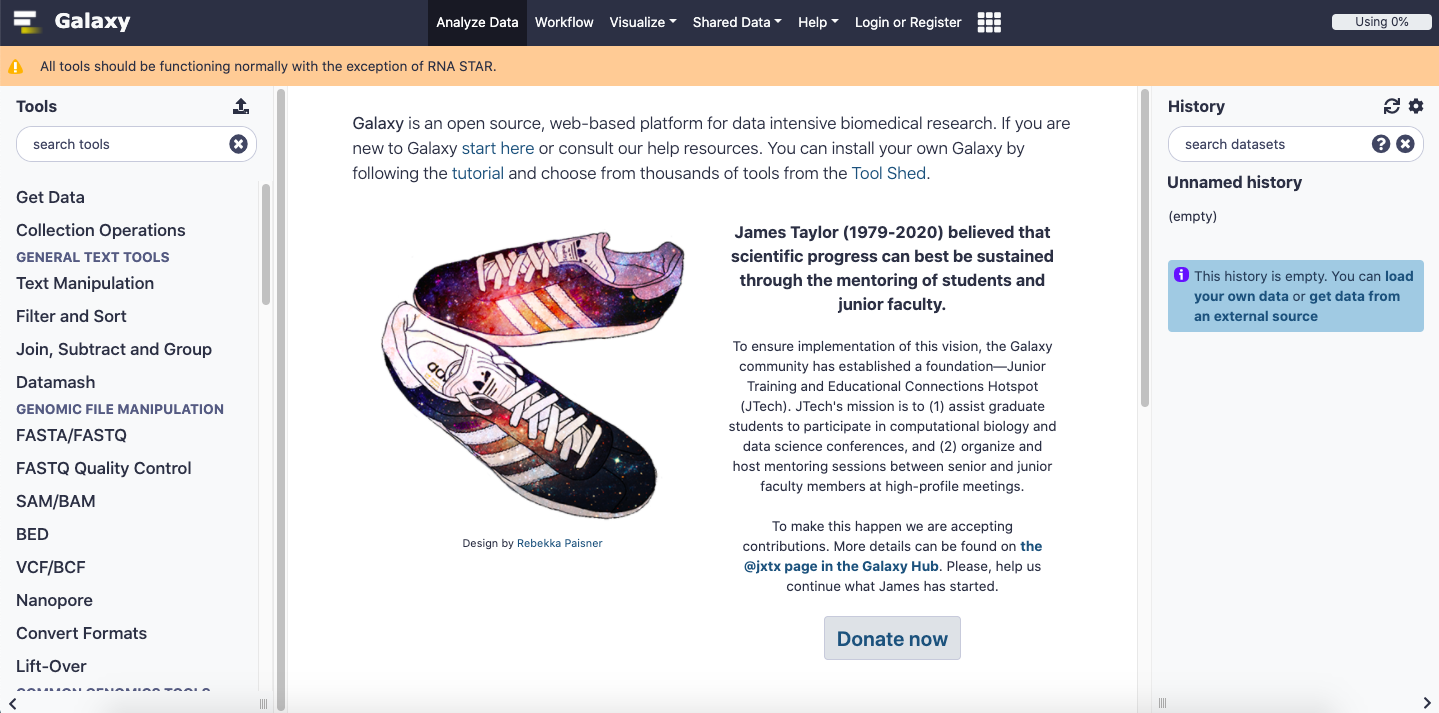
In recent years, with the development of various cloud computing platforms (such as Galaxy and DNAnexus in the biomedical field) and IT hardware and software (such as distributed computing, container technology, package manager, workflow language, etc.), junior researchers can easily obtain the upstream result. Moreover, when the upstream analysis process of conventional omics data tends to be stable and perfect, the customization and variability of the upstream analysis process have been greatly reduced. The visualization and personalized in-depth interpretation in the downstream process of data analysis have become the biggest challenge facing current users:
Hiplot is one of the community-driven bioinformatics data visualization platforms. This project started in October 2019 and accelerate in 2020 after COVID-19 breakout. It consists of a 6-person core team covering the IT, bioinformatics students, statistical analysts, and clinicians. The interdisciplinary cooperation may help us for better development of this application. The major development goals of Hiplot:
Untill now, we have been developed more than 40 visualization plugins on the Hiplot platform and are still increasing:
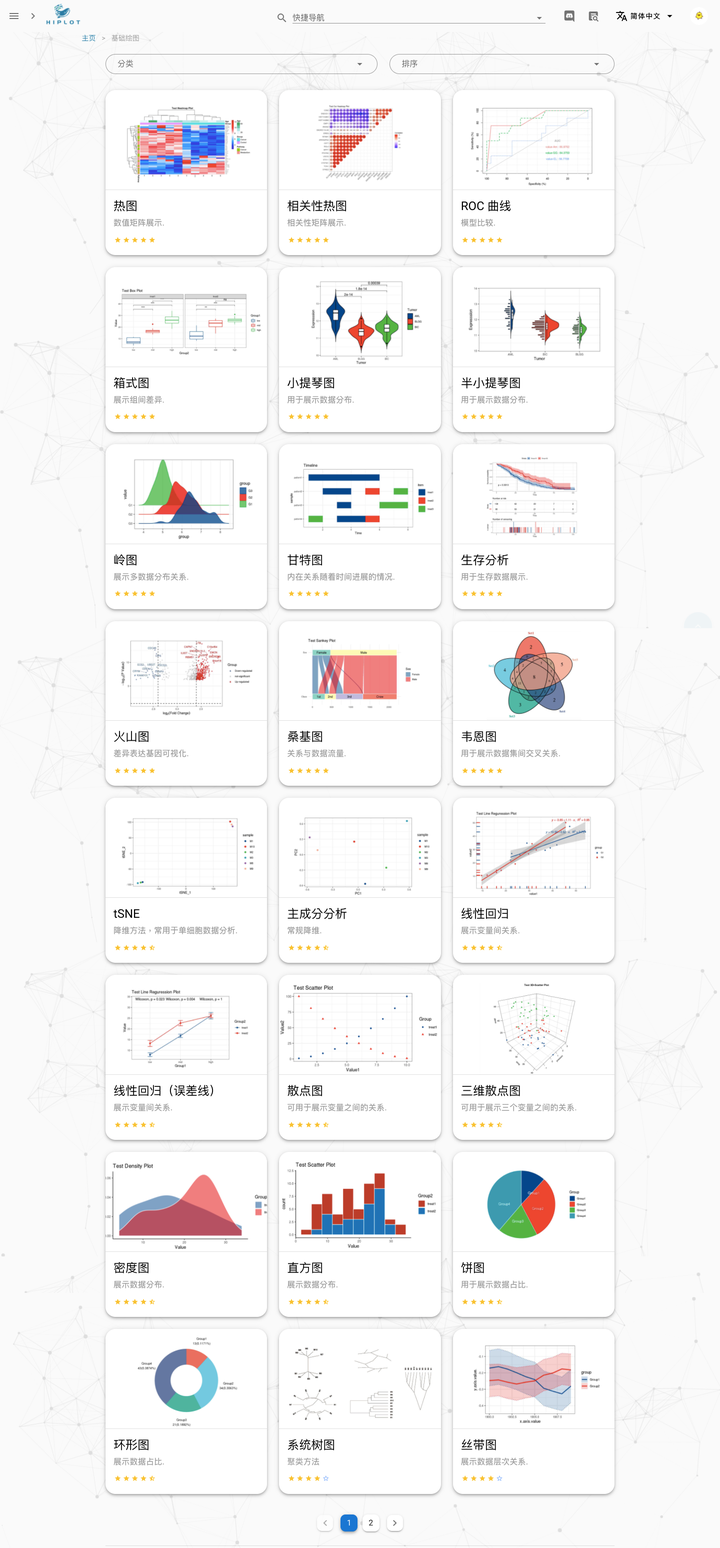
User Interface Examples:
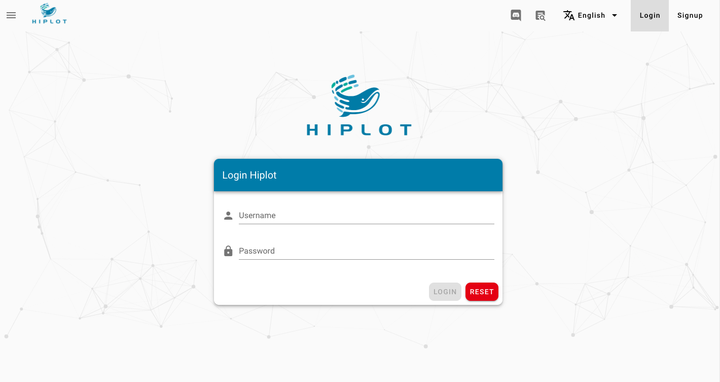
Login
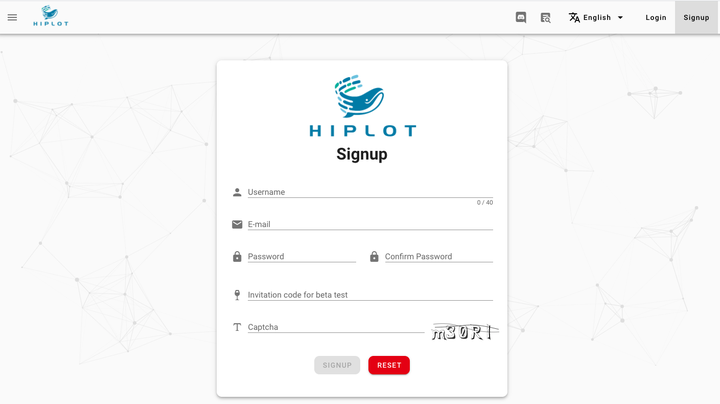
Signup
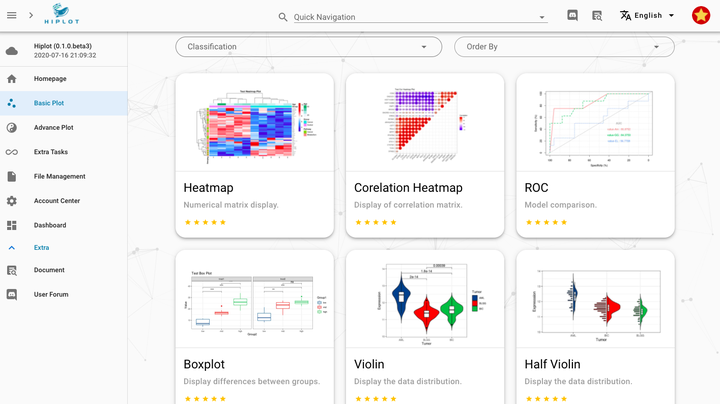
Overview of basic plots
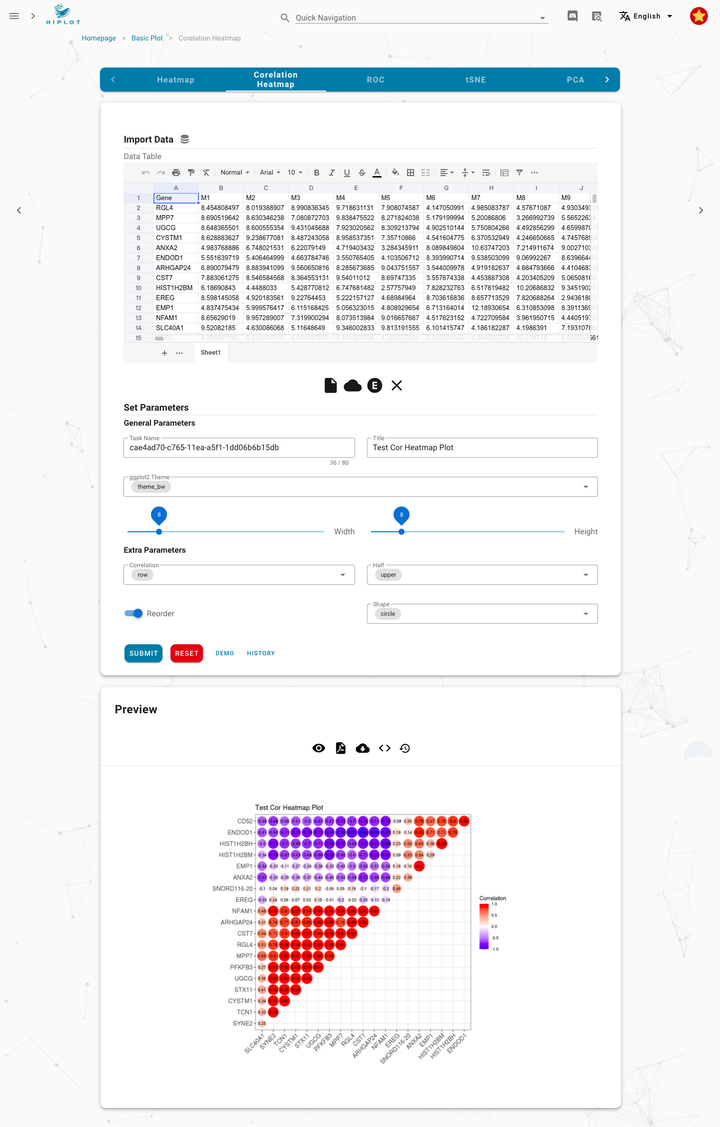
Demo | Correlation heatmap
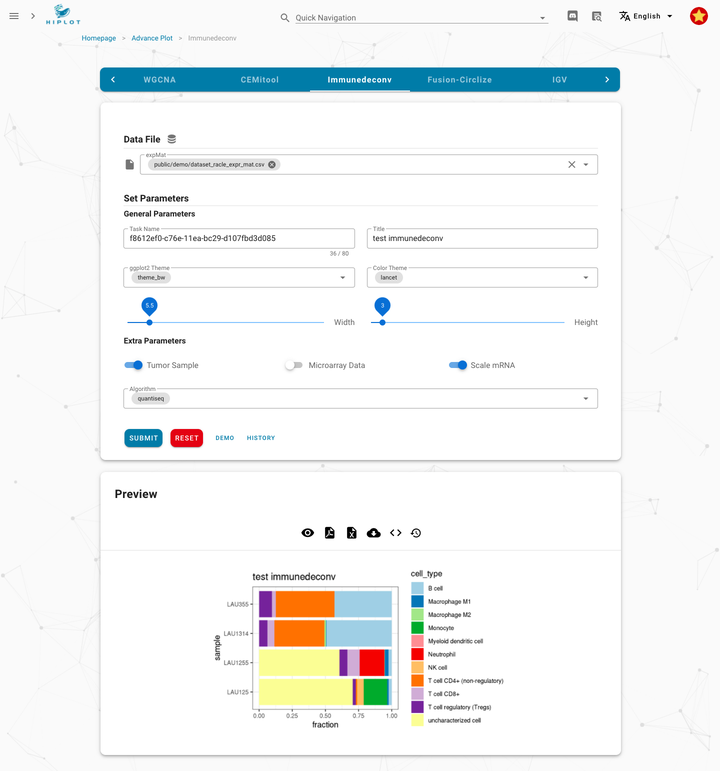
Demo | Immune Infiltration Analysis
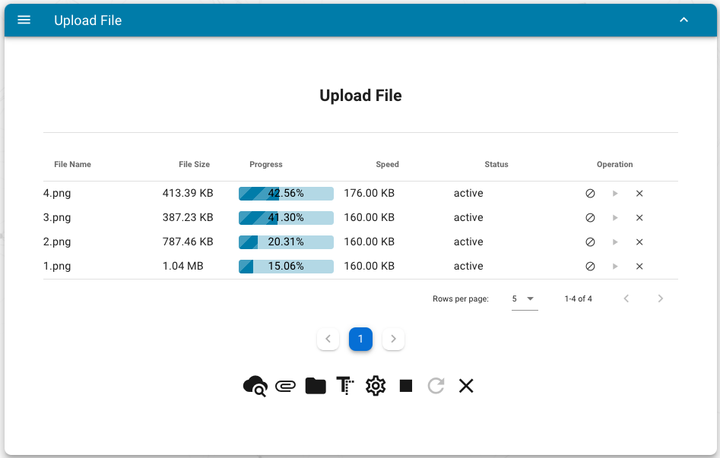
Upload files
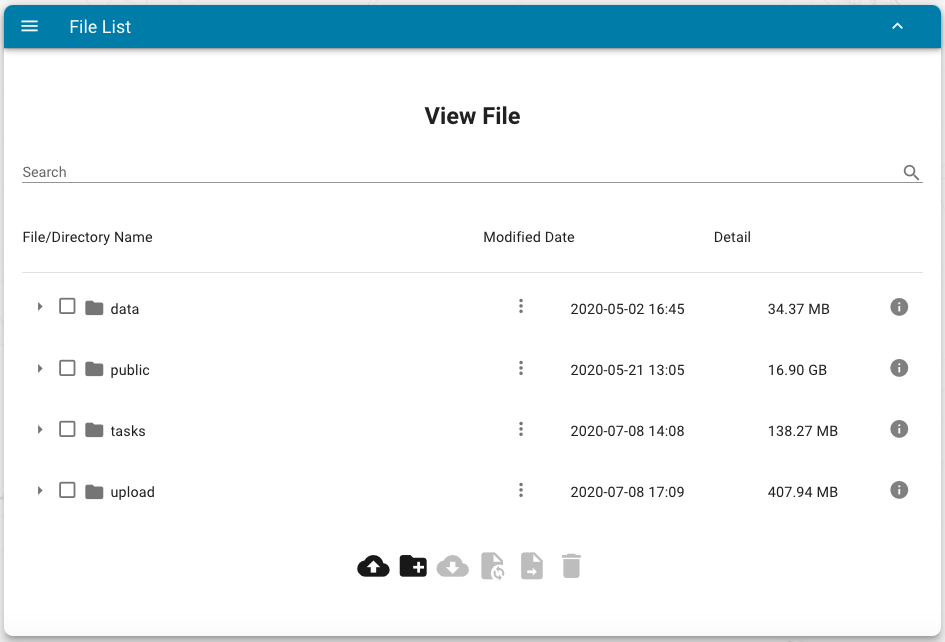
Manager of files
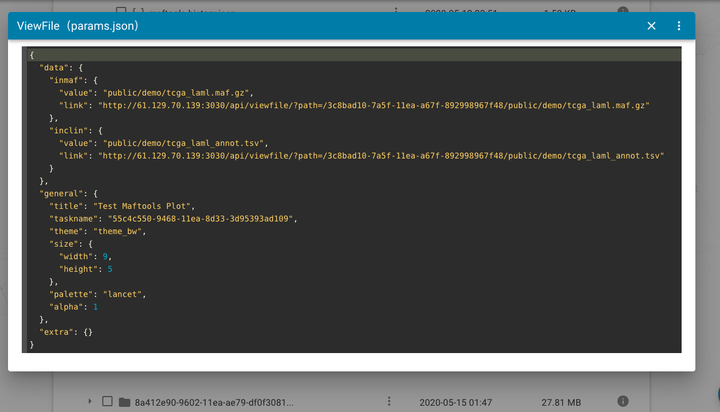
Online view and edit files
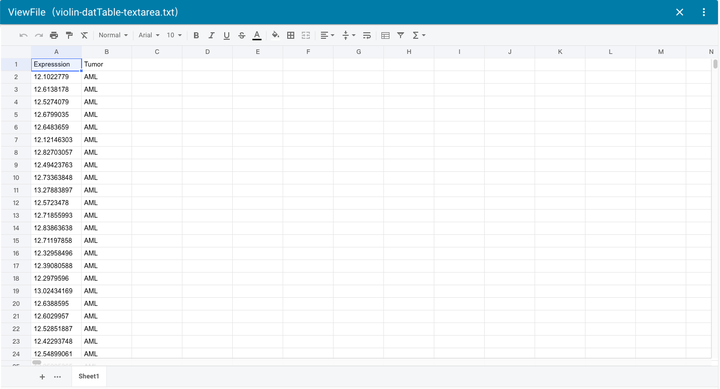
Online view and edit files
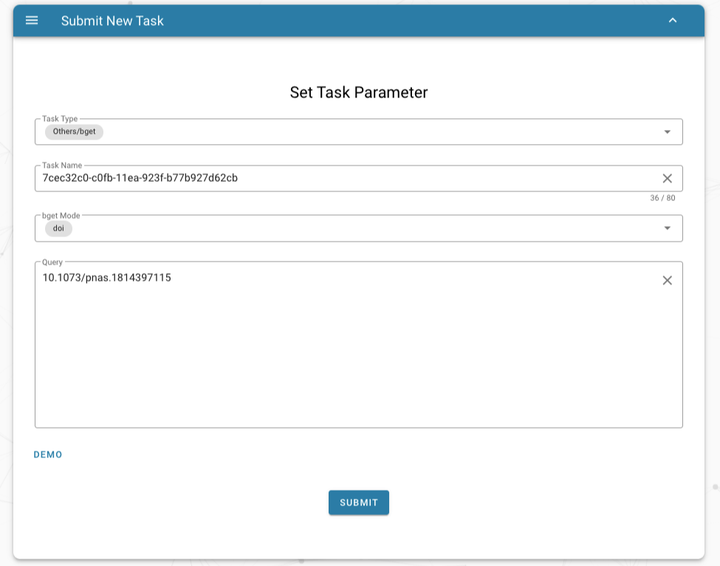
Download publications and supplementary data based on bget
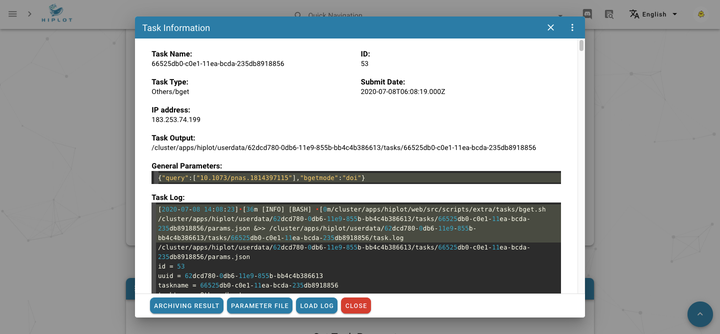
Download publications and supplementary data based on bget
If you want to contribute the Hiplot project, you can fell free to join our community: Discord.
This work is licensed under a Creative Commons Attribution 4.0 International License.
此处可能存在不合适展示的内容,页面不予展示。您可通过相关编辑功能自查并修改。
如您确认内容无涉及 不当用语 / 纯广告导流 / 暴力 / 低俗色情 / 侵权 / 盗版 / 虚假 / 无价值内容或违法国家有关法律法规的内容,可点击提交进行申诉,我们将尽快为您处理。


