

代码拉取完成,页面将自动刷新
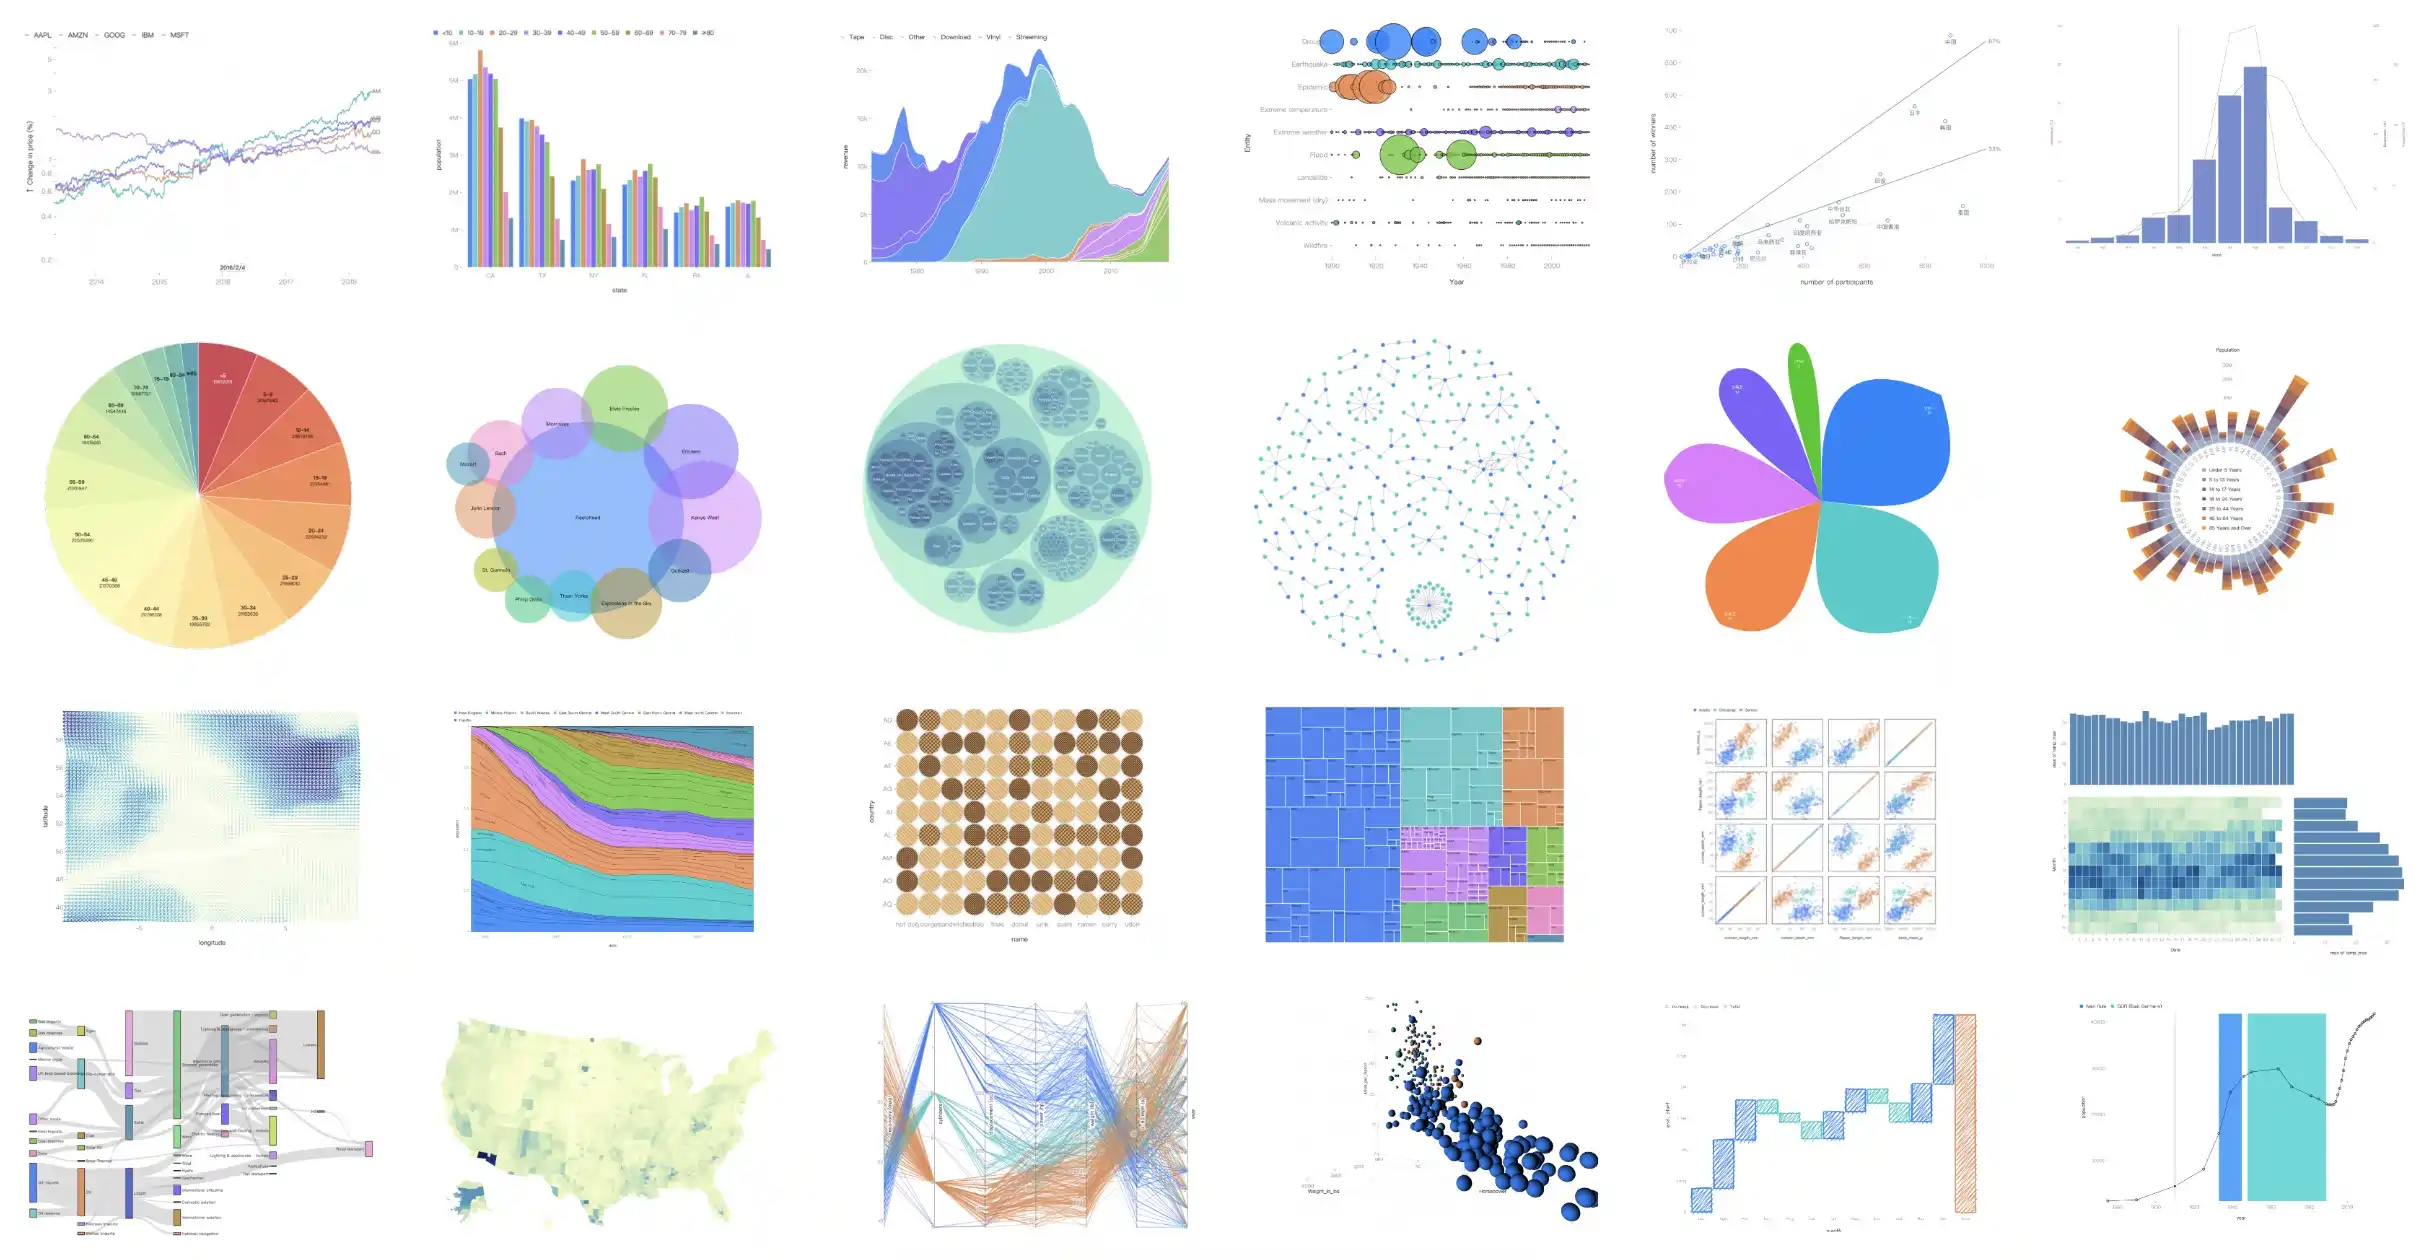
G2 is a visualization grammar for dashboard building, data exploration and storytelling.
This project was created to allow us to render G2 charts in streamlit. Live Demo.
![]()
![]()


pip install streamlit-g2
import streamlit as st
from streamlit_g2 import g2
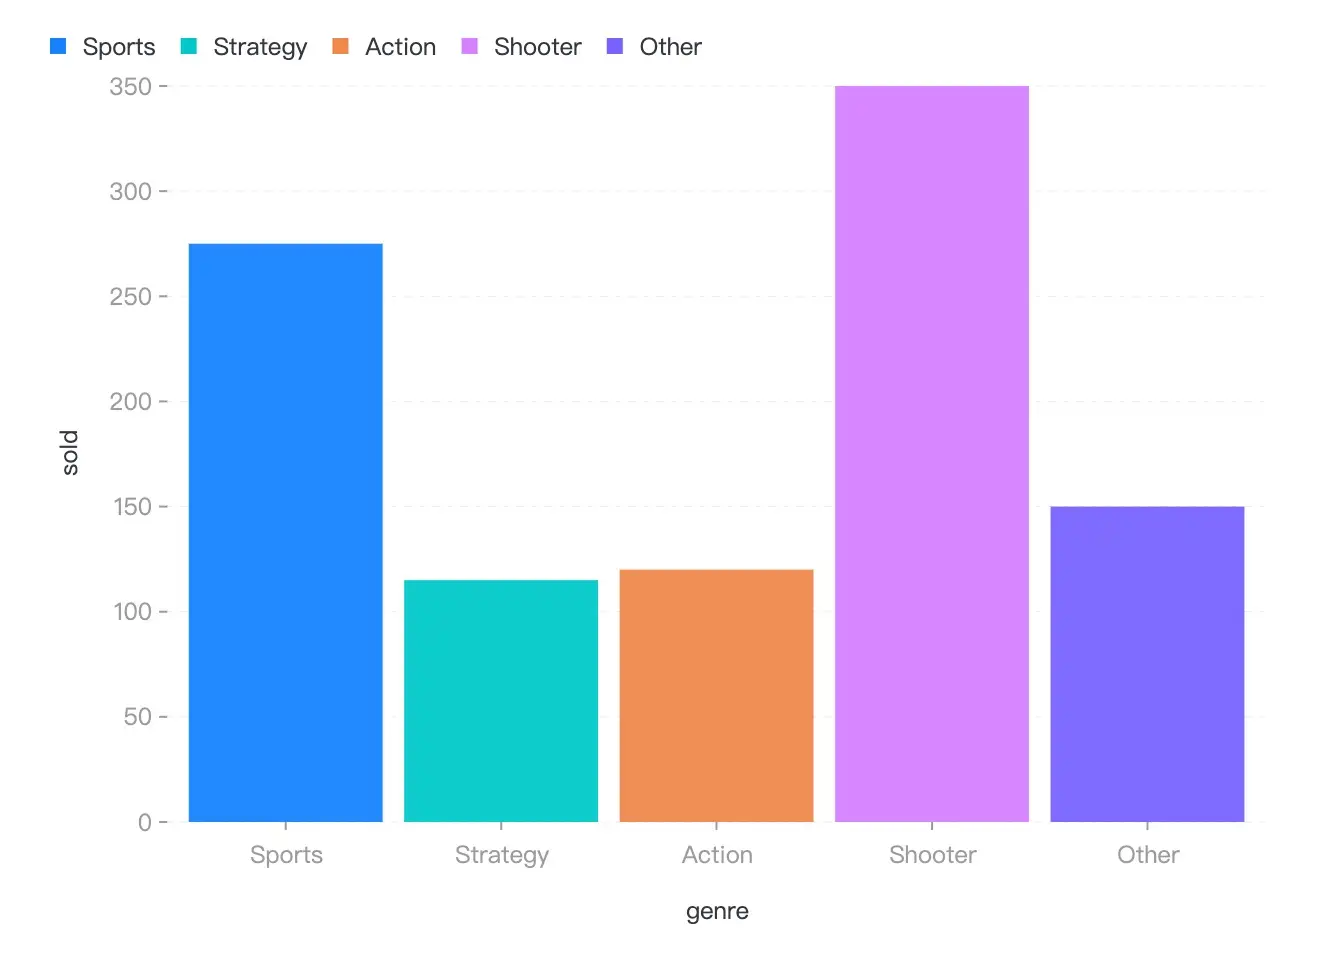
options = {
"type": "interval",
"data": [
{ "genre": 'Sports', "sold": 275 },
{ "genre": 'Strategy', "sold": 115 },
{ "genre": 'Action', "sold": 120 },
{ "genre": 'Shooter', "sold": 350 },
{ "genre": 'Other', "sold": 150 },
],
"encode": {
"x": "genre",
"y": "sold",
"color": "genre",
}
}
g2(options=options, style=None, key="streamlit_g2")
Now, There is only one API for streamlit-g2, named g2, see the options in G2 Spec API.
| Property | Description | Type | Default |
|---|---|---|---|
| options | the options for the visualization, say chart.options(options)
|
G2options | null
|
- |
| style | the style of the container | CSSProperties |
- |
npm run build in fold streamlit_g2/frontend.streamlit run app.py in root dir.MIT@hustcc.
此处可能存在不合适展示的内容,页面不予展示。您可通过相关编辑功能自查并修改。
如您确认内容无涉及 不当用语 / 纯广告导流 / 暴力 / 低俗色情 / 侵权 / 盗版 / 虚假 / 无价值内容或违法国家有关法律法规的内容,可点击提交进行申诉,我们将尽快为您处理。
1. 开源生态
2. 协作、人、软件
3. 评估模型


