代码拉取完成,页面将自动刷新
同步操作将从 antv/G6 强制同步,此操作会覆盖自 Fork 仓库以来所做的任何修改,且无法恢复!!!
确定后同步将在后台操作,完成时将刷新页面,请耐心等待。
Beta Published Content | How to Use the Features


![]()
![]()
![]()


![]()
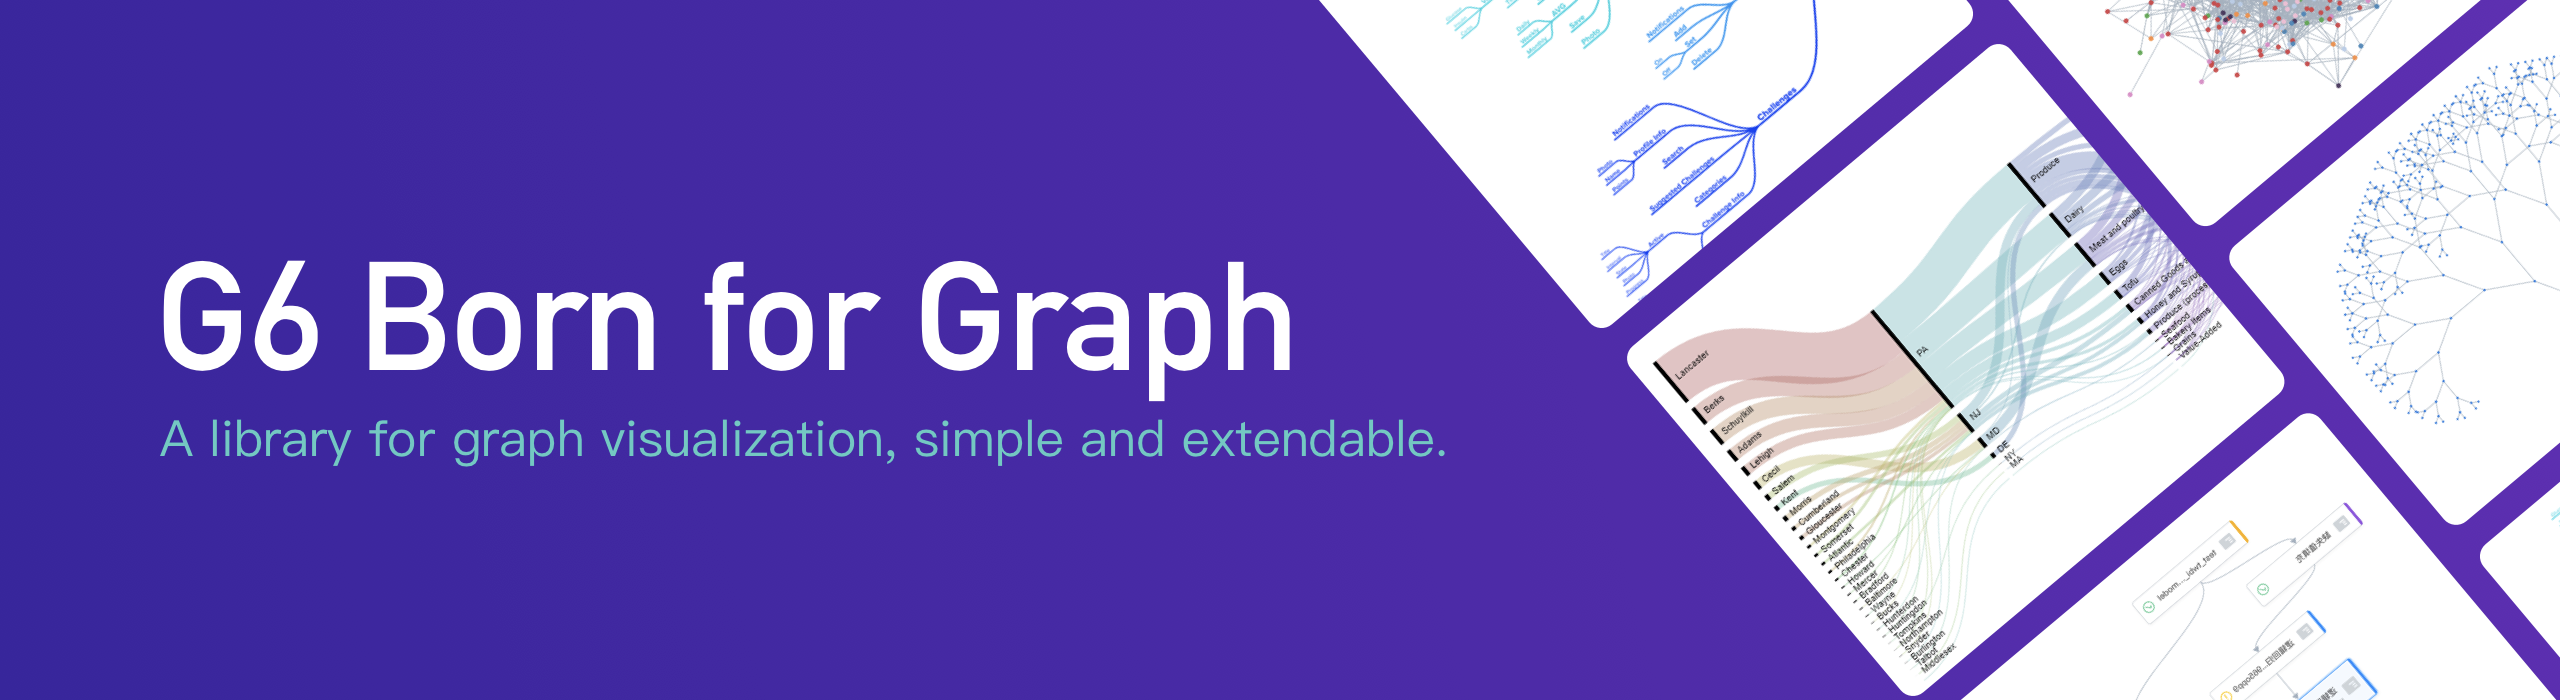
G6 is a graph visualization engine, which provides a set of basic mechanisms, including rendering, layout, analysis, interaction, animation, and other auxiliary tools. G6 aims to simplify the relationships, and help people to obtain the insight of relational data. Developers are able to build graph visualization analysis applications or graph visualization modeling applications easily.


G6 concentrates on the principle of 'good by default'. In addition, the custom mechanism of the item, interation behavior, and layout satisfies the customazation requirements.
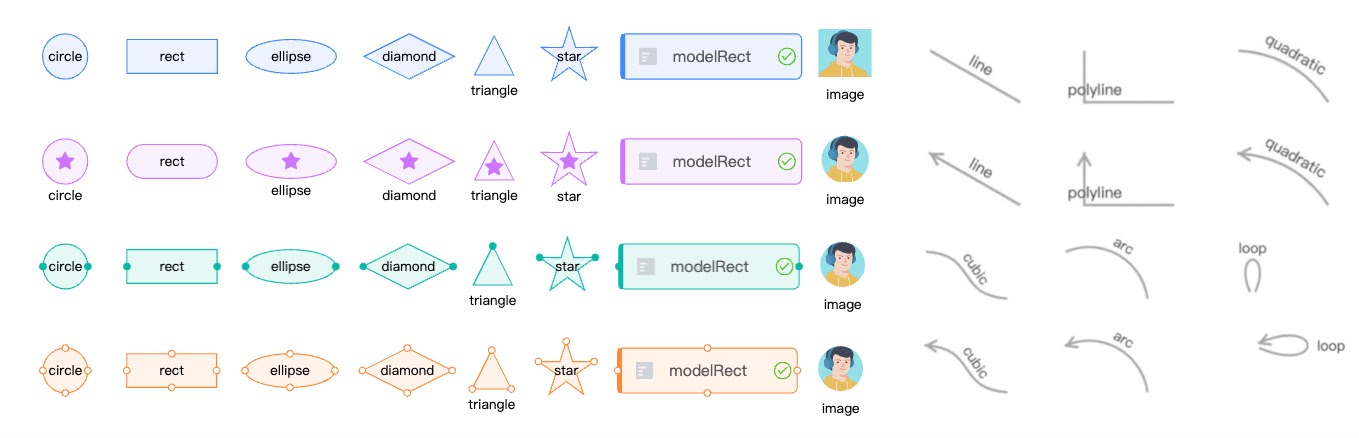
Abundant Built-in Items
$ npm install @antv/g6

import G6 from '@antv/g6';

const data = {
  nodes: [
    {
      id: 'node1',
      label: 'Circle1',
      x: 150,
      y: 150,
    },
    {
      id: 'node2',
      label: 'Circle2',
      x: 400,
      y: 150,
    },
  ],
  edges: [
    {
      source: 'node1',
      target: 'node2',
    },
  ],
};

const graph = new G6.Graph({
  container: 'container',
  width: 500,
  height: 500,
  defaultNode: {
    type: 'circle',
    size: [100],
    color: '#5B8FF9',
    style: {
      fill: '#9EC9FF',
      lineWidth: 3,
    },
    labelCfg: {
      style: {
        fill: '#fff',
        fontSize: 20,
      },
    },
  },
  defaultEdge: {
    style: {
      stroke: '#e2e2e2',
    },
  },
});

graph.data(data);
graph.render();

For more information of the usage, please refer to Getting Started.
# install dependencies (with pnpm)
pnpm install

# build
pnpm build

# start the dev server
pnpm start

# if you wanna watch one of the packages, e.g. packages/core
$ cd ./packages/core
$ npm run watch

# run test case
$ npm test

# run test case in watch mode
npm test -- --watch ./tests/unit/algorithm/find-path-spec
DEBUG_MODE=1 npm test -- --watch ./tests/unit/algorithm/find-path-spec
For React project integration, we have an independent product recommendation: Graphin, which is a toolkit based on G6 and React, that focuses on relational visual analysis. It's simple, efficient, out of the box.
At present, Graphin has good practices in business graph analysis projects. For details, see 《Who uses Graphin》
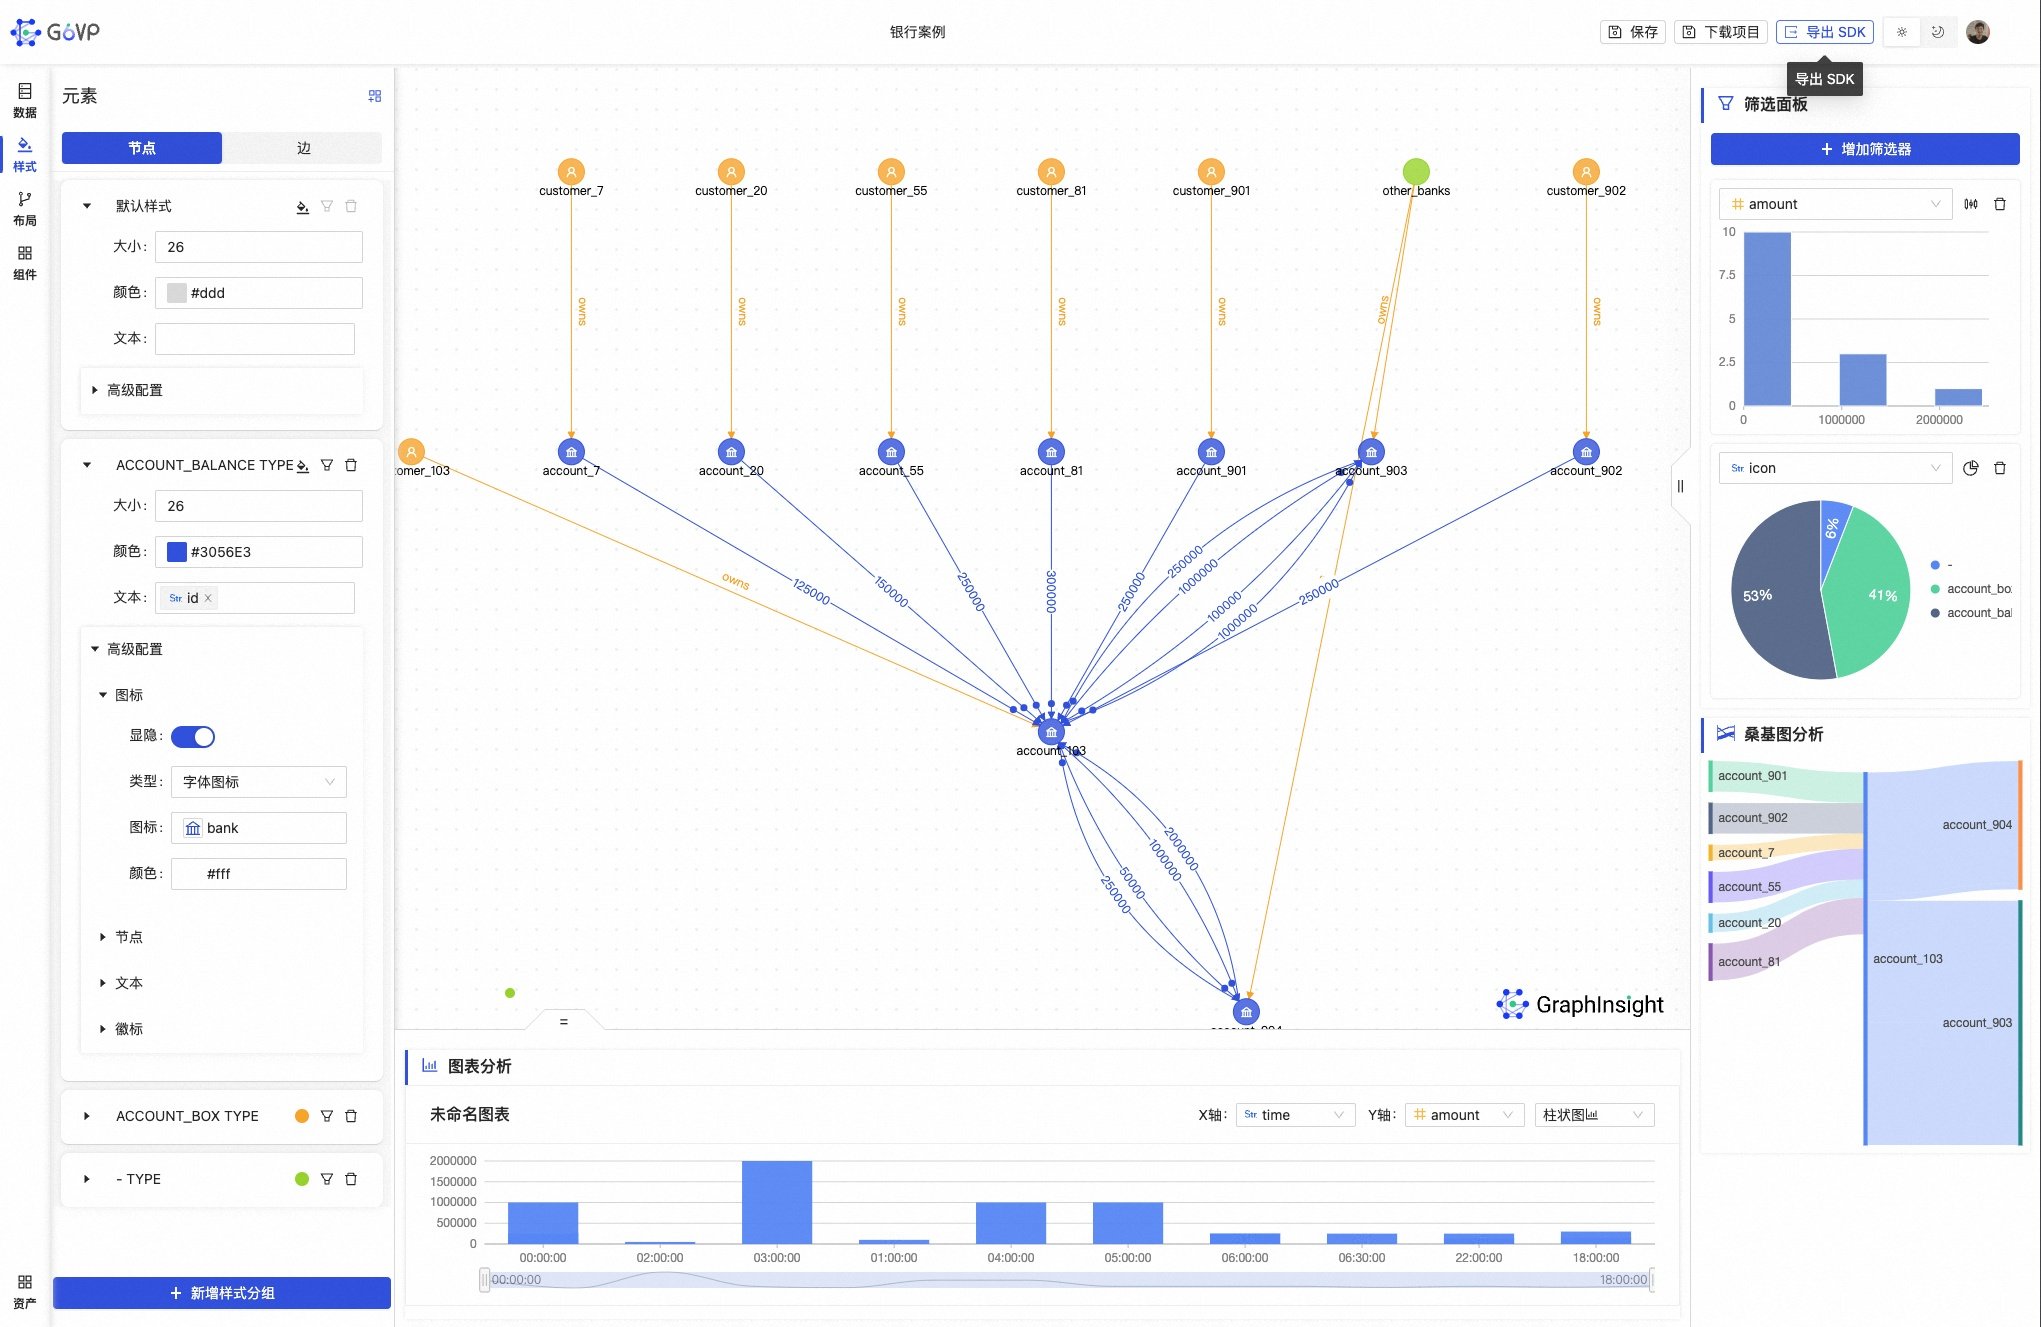
If you have a piece of relational data (graph data) and want to quickly visualize it online and analyze it efficiently, then we recommend using the official G6VP, which supports local File JSON, Excel, and graph data sources such as TuGraph, Neo4J, and GraphScope are also supported. With 60+ built-in analysis assets, graph analysis can be as simple as building blocks. The platform also provides one-click export of SDK, which can be quickly integrated into the business system
Welcome to join the G6 Communication Group or G6 Communication Group-2 (DingTalk groups). We also welcome the github issues.


Please let us know what you are you going to help. Do check out issues for bug reports or suggestions first.
此处可能存在不合适展示的内容,页面不予展示。您可通过相关编辑功能自查并修改。
如您确认内容无涉及 不当用语 / 纯广告导流 / 暴力 / 低俗色情 / 侵权 / 盗版 / 虚假 / 无价值内容或违法国家有关法律法规的内容,可点击提交进行申诉,我们将尽快为您处理。